- Home
- News
- Spotlight on Science
- 3D imaging of a...
3D imaging of a dislocation loop at the onset of plasticity in an indented nanocrystal
07-12-2017
The microstructure of a nanocrystal undergoing in situ mechanical loading was monitored by imaging in 3D with 13 nm resolution. Observations included the evolution of the strain field after successive loadings and the nucleation of a dislocation loop.
Understanding the stability and the mechanical response of micro and nanocrystalline materials is a long-standing topic of investigation, driven since the 1970s by efforts to reduce the length-scale for functional devices in microelectronics. Strength evolution with size supports the phenomenological ‘smaller is stronger’ statement [1], but the scaling down in length scale also reveals the intrinsic discrete nature of the strain response since each dislocation carries a quantum of deformation (the magnitude of its Burgers vector b). Hence, for a given sample size, a large variation in mechanical response is observed experimentally at the micrometre scale [2]. Therefore, the mechanical behaviour of micro/nanocrystals under mechanical stimuli cannot be understood without an accurate knowledge of the microstructure (residual strain field and defect content), and a full picture of the size effect on strength can only be studied by investigating the relationship between the microstructure and the mechanical response.
In this work, the evolution of the microstructure of a gold nanocrystal was followed during the very first stages of its indentation. Bragg coherent diffraction imaging (BCDI) at beamline ID01 was used to obtain quantitative 3D images of its structure at the nanoscale [3] (Figure 1). The BCDI measurements were performed by recording the 3D intensity distribution around the 111 Bragg reflection. In situ mechanical stimuliwere applied with a dedicated compact AFM (SFINX) [4] mounted on the diffractometer, and the crystal microstructure was imaged after a few indentation cycles. The reconstructed real space data after the third loading/unloading iteration reveals the presence of a dislocation loop of ~65 nm diameter nucleated during loading and trapped in the crystal. The analysis of the density and phase data, which are consistent with those around simulated dislocation loops [5], allowed the unambiguous identification of the prismatic nature of the dislocation loop (Figure 2). The prismatic loop exits the crystallite volume after the fourth loading iteration and the reconstructed displacement fields appear to be very homogeneous suggesting a partial relaxation of the strain field in the crystallite. To obtain a full representation of the strain field and elastic energy within the particle, FEM based calculations were carried out to complete the missing displacement components for each reconstructed configuration. The computation of the elastic stored energy revealed the same trend as the function of the applied force: an initial increase until the nucleation of the prismatic loop takes place followed by a decrease bringing the system back close to its initial state. Hence, the calculated elastic energy stored in the crystal shows clearly the footprint of the dislocation loop nucleation that relaxes the stress and brings the island back to an almost strain-free state.
 |
|
Figure 1. Schematic illustration of the experiment. |
This work demonstrates the feasibility of monitoring and imaging in 3D the evolution of the microstructure of nanocrystals exposed to mechanical loading by BCDI. Importantly, the technique has the spatial resolution and the displacement sensitivity required to reveal the individual discrete events forming the mechanical response, such as the nucleation and disappearance of a single dislocation loop, and to relate it to the local strain field. Altogether, this approach opens a new avenue for the study of mechanical properties at the nanoscale, offering a non-invasive 3D structural microscopy for nanocrystals and with a quantitative sensitivity that outperforms electron microscopy.
 |
|
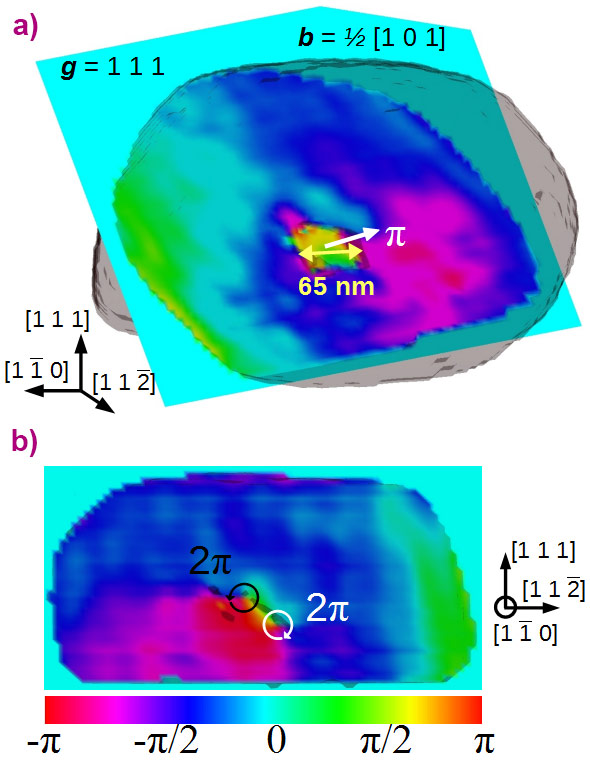
Figure 2. (a) Reconstructed experimental φ1 1 1 phase fields in the (1 0 1) plane normal to the glide cylinder of the prismatic loop. The electron density drawn at 21% of the maximum electron density is superimposed in transparency to indicate the position of the loop. (b) Reconstructed φ1 1 1 phase field in the (1 -1 0) plane intercepting the prismatic loop in two loci. |
Principal publication and authors
3D Imaging of a dislocation loop at the onset of plasticity in an indented nanocrystal, M. Dupraz (a), G. Beutier (a), T.W. Cornelius (b), G. Parry (a), Z. Ren (b), S. Labat (b), M.-I. Richard (b,c), G.A. Chahine (a), O. Kovalenko (d), M. De Boissieu (a), E. Rabkin (d), M. Verdier (a), O. Thomas (b), Nano Lett. 17, 6696-6701 (2017); doi: 10.1021/acs.nanolett.7b02680.
(a) Univ. Grenoble Alpes, CNRS, SIMAP, Grenoble (France)
(b) Aix Marseille Univ., Université de Toulon, CNRS, IM2NP, Marseille (France)
(c) ESRF
(d) Department of Materials Science and Engineering, Technion – Israel Institute of Technology, Haifa (Israel)
References
[1] M.D. Uchic et al., Science 305, 986–989 (2004).
[2] H. Bei et al., Acta Mater. 56, 4762-4770 (2008).
[3] I. Robinson & R. Harder, Nat. Mater. 8, 291–298 (2009).
[4] Z. Ren et al., J. Synchrotron Radiat. 21, 1128–1133 (2014).
[5] M. Dupraz et al., J. Appl. Crystallogr. 48, 621–644 (2015).
partners


European Synchrotron Radiation Facility - 71, avenue des Martyrs, CS 40220, 38043 Grenoble Cedex 9, France.